Creating a Dashboard in Grafana
Grafana is an open-source platform widely used for monitoring and visualizing data. With Grafana, users can create rich, interactive dashboards to display data from various sources such as Prometheus, InfluxDB, Elasticsearch, and more. This guide will walk you through the steps to create a dashboard in Grafana.
Prerequisites
- Install Grafana: Ensure that you have Grafana installed and configured. You can download Grafana from the official website and follow the documentation for installation.
- Configure Data Sources: Before creating a dashboard, you need to configure your data sources. In the Grafana sidebar, navigate to
Configuration->Data Sourcesand follow the prompts to add and configure your data source.
Steps to Create a Dashboard
- Log in to Grafana: Use your admin account to log in to the Grafana console.
- Create a New Dashboard:
- Click the
+sign in the sidebar and selectDashboard. - In the new page that appears, click
Add new panelto add a new panel.
- Click the
- Configure the Panel:
- Select Data Source: In the right-hand panel configuration area, select the data source you configured earlier.
- Write Query: Depending on your data source, write the appropriate query. For example, if you are using Prometheus, you can use PromQL.
- Choose Chart Type: Grafana supports various chart types (e.g., line charts, bar charts, pie charts). Choose the one that best suits your needs.
- Set Other Parameters: You can set the panel title, legend display, unit formats, and more according to your requirements.
- Save the Panel:
- After configuring the panel, click the
Applybutton in the top right corner to add it to the dashboard. - Repeat the above steps to add multiple panels to create a comprehensive dashboard with various data visualizations.
- After configuring the panel, click the
- Save the Dashboard:
- Once all panels are configured, click the
Save dashboardbutton in the top right corner. - In the dialog that appears, give your dashboard a name and choose a folder to save it in (the default folder is
General). - Click the
Savebutton to save your dashboard.
- Once all panels are configured, click the
Advanced Features
- Template Variables: Grafana allows the use of template variables in dashboards, enabling the creation of dynamic and reusable dashboards. You can add and configure variables in
Settings->Variables. - Alerting: Grafana allows you to set up alert rules in panels that trigger notifications when certain conditions are met. You can configure alerts in the
Alerttab of the panel. - Sharing and Exporting: You can share your dashboard with other users or export it as a JSON file for backup and migration. Click the
Sharebutton in the top right corner and choose the appropriate option.
Import Panels
When creating a new panel, select Import Panel
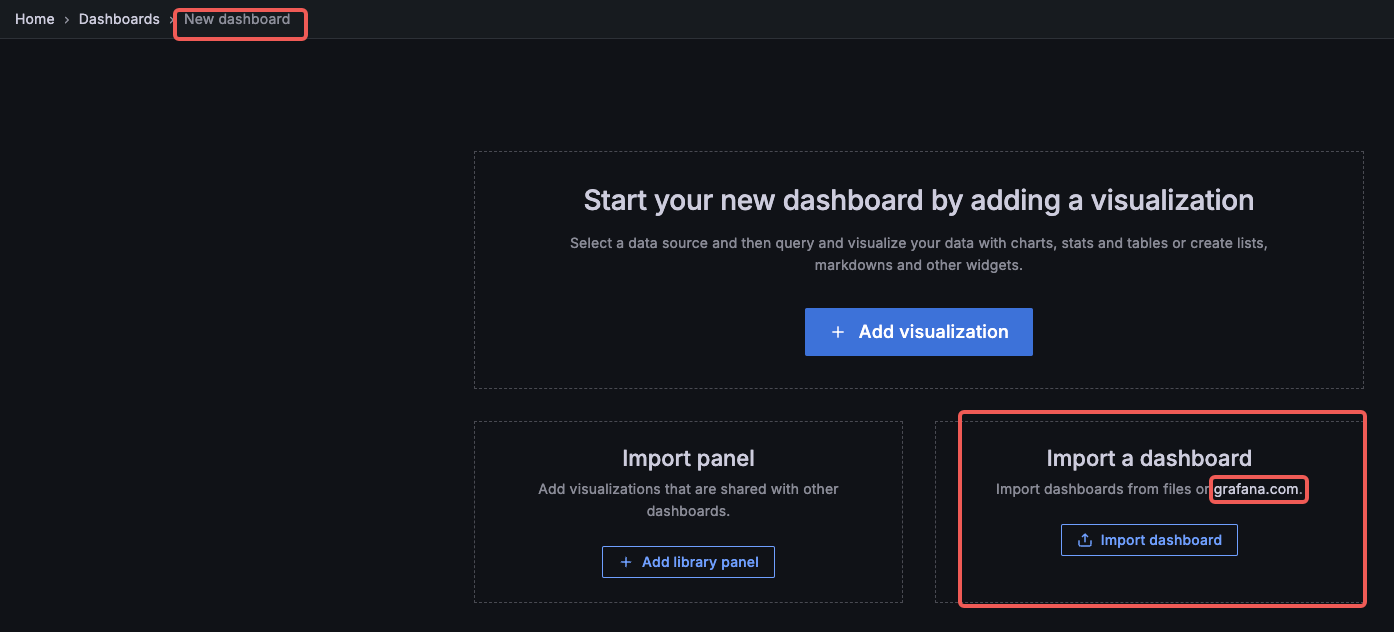
In Grafana’s panel choose an appropriate panel based on your data source,
https://grafana.com/grafana/dashboards/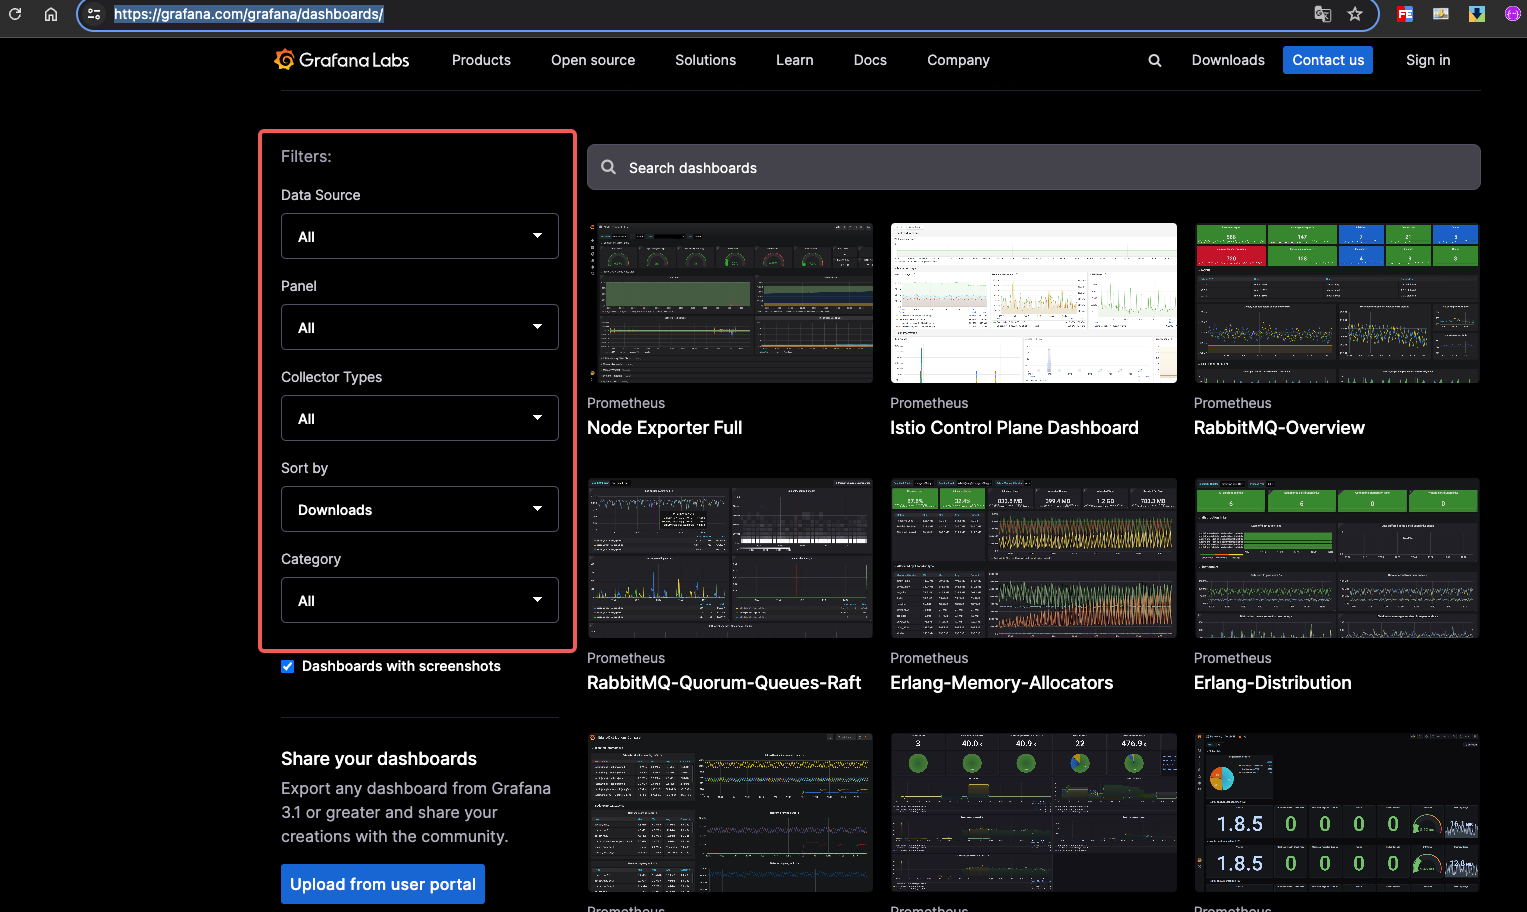
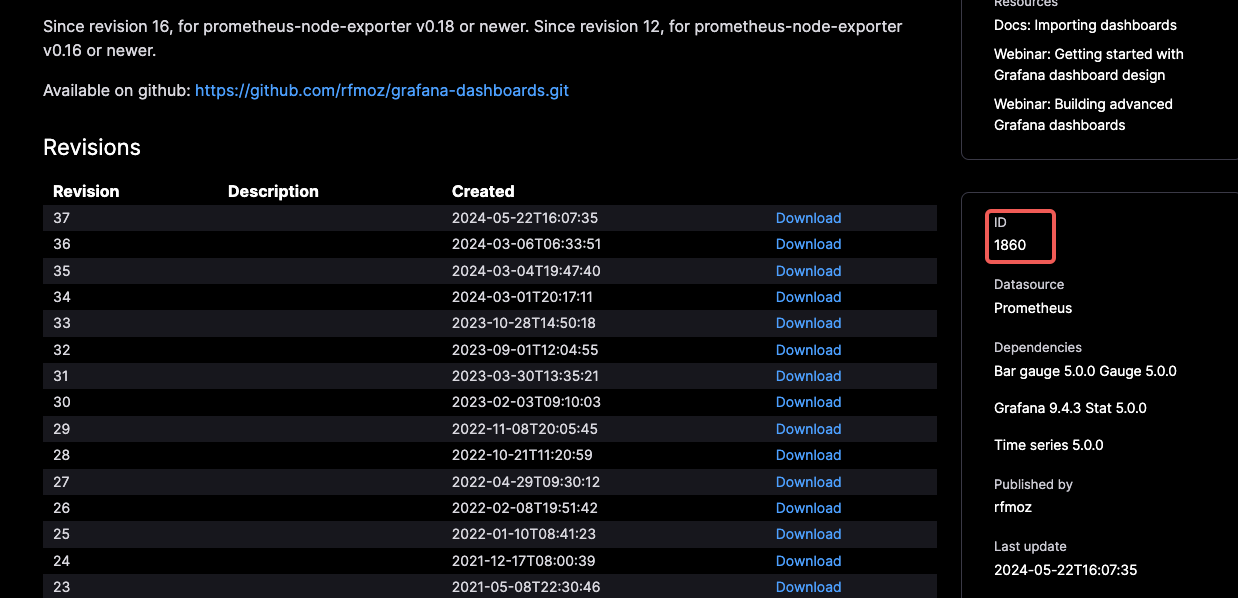
Click Select Panel, drop down the page to find the panel id, copy the id
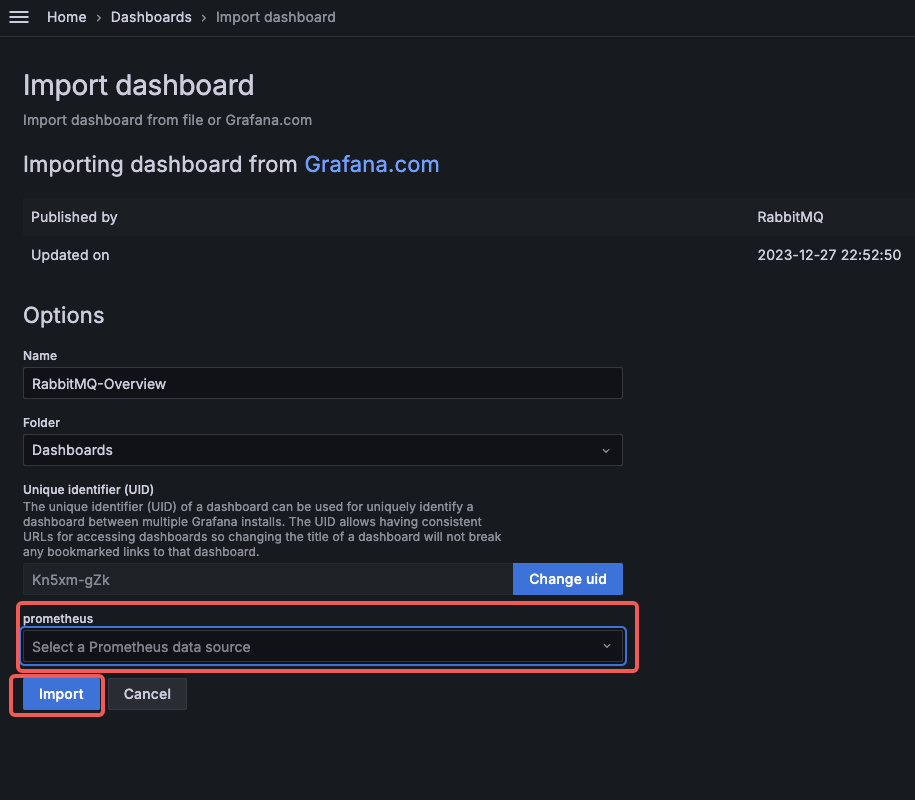
On the Grafana Import Panel page, enter the id and click the load button
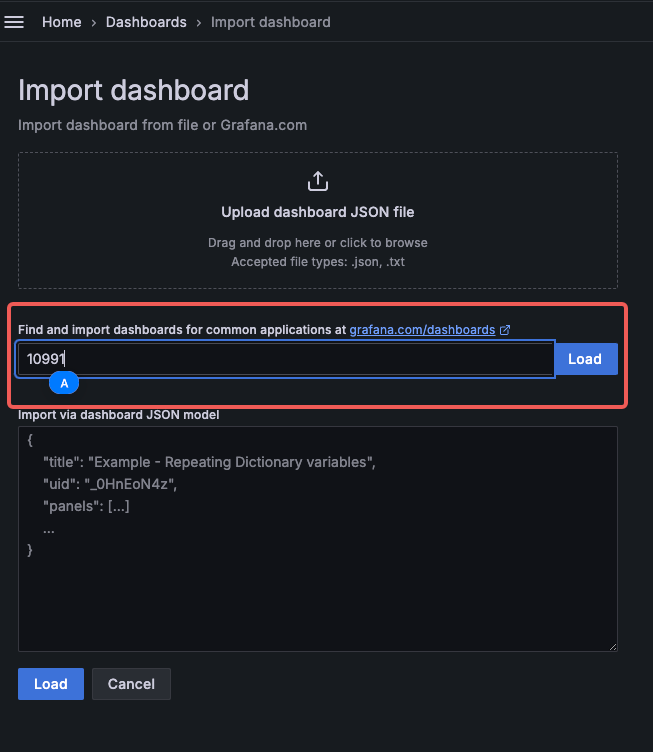
Select the appropriate data source and click the import button
Conclusion
By following the steps outlined above, you can easily create a powerful dashboard in Grafana to monitor and visualize various data. Grafana offers a wide range of configuration options and plugins, allowing you to customize your dashboards to meet your specific needs, thereby enhancing data monitoring and analysis efficiency.