Configuring Prometheus and Loki Data Sources in Grafana
In this tutorial, we will walk through the steps to configure Prometheus and Loki data sources in Grafana. This will enable you to collect and visualize metrics (Prometheus) and logs (Loki) for better monitoring and diagnosing of your system.
Prerequisites
Before starting, ensure you have the following in place:
- Grafana installed and running.
- Prometheus installed and running.
- Loki installed and running.
Step 1: Configure Prometheus Data Source
1. Log in to Grafana
First, open your browser and log in to the Grafana web interface. Use your username and password to log in.
2. Add Prometheus Data Source
- In the left-hand navigation panel of the Grafana dashboard, click on the gear icon (Configuration).
- Select Data Sources.

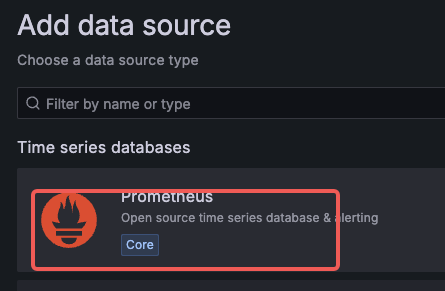
- Click the Add data source button at the top right of the page.
- From the list that appears, select Prometheus.
3. Configure Prometheus Data Source
In the HTTP section, fill in the following fields:
- URL: Enter the URL of your Prometheus server (e.g.,
http://prometheus-server.prometheus.svc.cluster.local).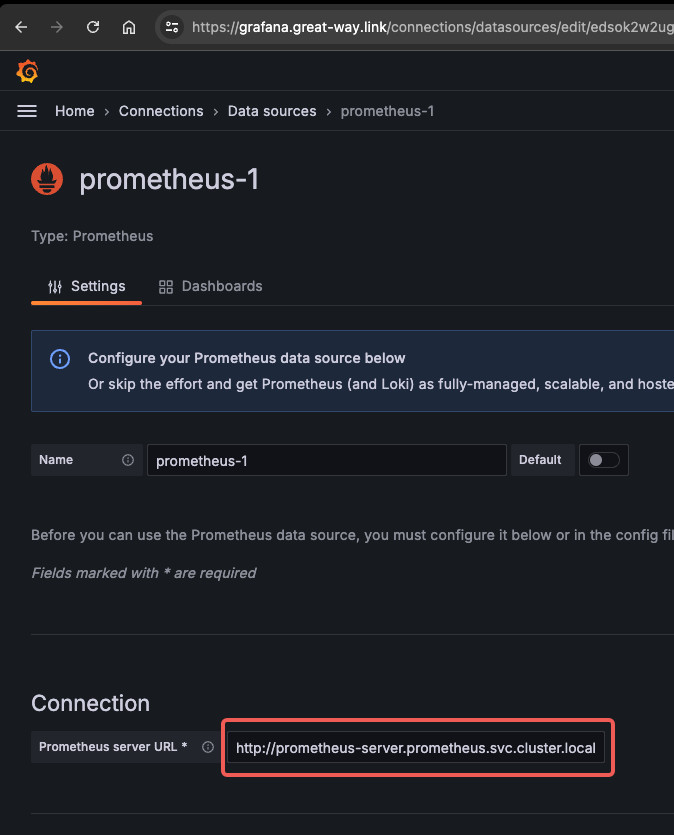
- URL: Enter the URL of your Prometheus server (e.g.,
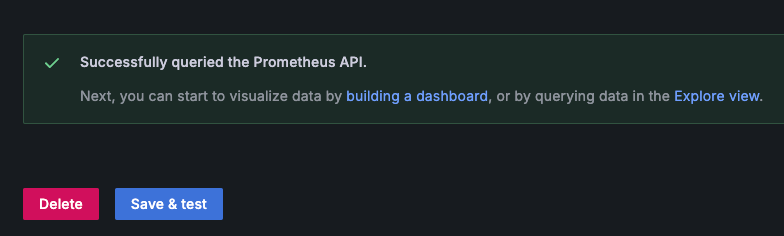
Click the Save & Test button at the bottom of the page to verify the configuration.
If the configuration is correct, you will see a “Successfully queried the Prometheus API.” message.
Step 2: Configure Loki Data Source
1. Add Loki Data Source
- In the left-hand navigation panel of the Grafana dashboard, click on the gear icon (Configuration).
- Select Data Sources.
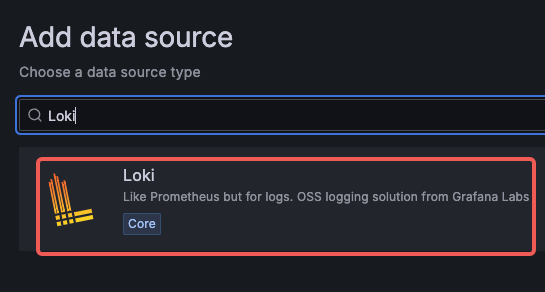
- Click the Add data source button at the top right of the page.
- From the list that appears, select Loki.
2. Configure Loki Data Source
In the HTTP section, fill in the following fields:
- URL: Enter the URL of your Loki server (e.g.,
http://loki-gateway.loki.svc.cluster.local).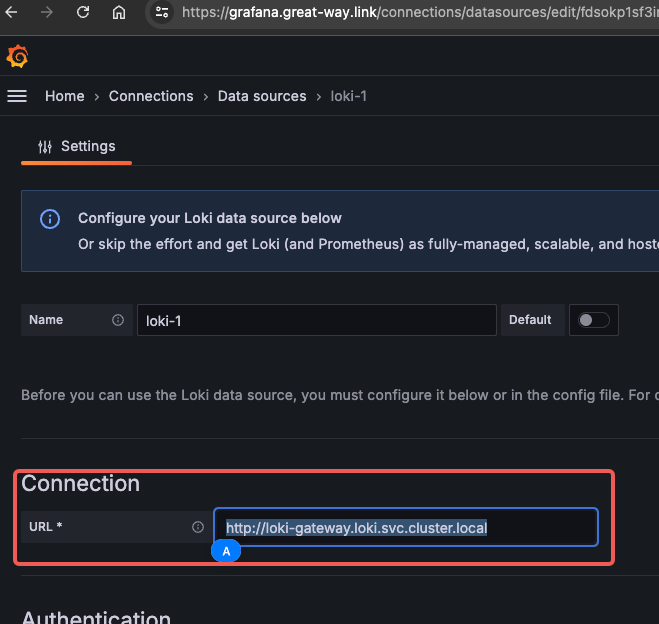
- URL: Enter the URL of your Loki server (e.g.,
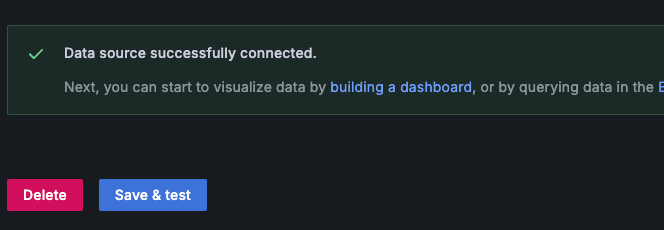
Click the Save & Test button at the bottom of the page to verify the configuration.
If the configuration is correct, you will see a “Data source successfully connected.” message.
Summary
By following these steps, you have successfully configured Prometheus and Loki data sources in Grafana . This setup will help you better monitor and diagnose your system, improving overall operational efficiency.